3.3 Target parameter optimization (tooling frequency)
The parameter settings of the design optimization are similar to those of the DOE. The difference is that the values ​​of two important parameters have been determined. In addition, there are three parameters related to the material properties, which are regarded as noise and cannot be optimized. The remaining three parameters that can be adjusted are the axial position of the slot, the length and the tooling width. Optimization uses the subproblem approximation method in ANSYS, which is a widely used method in engineering problems, and the specific process is omitted.
It is worth noting that using frequency as the target variable requires a little skill in operation. Because there are many design parameters and a wide range of variation, the vibration modes of the tooling are many in the frequency range of interest. If the result of modal analysis is directly used, it is difficult to find the first-order axial mode, because the modal sequence interleaving may occur when the parameters change, that is, the natural frequency ordinal corresponding to the original mode changes. Therefore, this paper adopts the modal analysis first, and then uses the modal superposition method to obtain the frequency response curve. By finding the peak value of the frequency response curve, it can ensure the corresponding modal frequency. This is very important in the automatic optimization process, eliminating the need to manually determine the modality.
After the optimization is completed, the design working frequency of the tooling can be very close to the target frequency, and the error is less than the tolerance value specified in the optimization. At this point, the tooling design is basically determined, followed by manufacturing tolerances for production design.
3.4 Tolerance design
The general structural design is completed after all design parameters have been determined, but for engineering problems, especially when considering the cost of mass production, tolerance design is essential. The cost of low precision is also reduced, but the ability to meet design specifications requires statistical calculations for quantitative calculations. The PDS Probability Design System in ANSYS can better analyze the relationship between design parameter tolerance and target parameter tolerance, and can generate complete related report files.
3.4.1 PDS parameter settings and calculations
According to the idea of ​​DFSS, the tolerance analysis should be carried out on important design parameters. Other general tolerances can be determined empirically. The situation in this paper is quite special, because according to the ability of machining, the manufacturing tolerance of geometric design parameters is very small, and has little effect on the final tooling frequency; while the parameters of raw materials are greatly different due to suppliers, and the price of raw materials accounts for More than 80% of tooling processing costs. Therefore, it is necessary to set a reasonable tolerance range for the material properties. The relevant material properties here are density, modulus of elasticity and speed of sound wave propagation.
Tolerance analysis uses random Monte Carlo simulation in ANSYS to sample the Latin Hypercube method because it can make the distribution of sampling points more uniform and reasonable, and obtain better correlation by fewer points. This paper sets 30 points. Assume that the tolerances of the three material parameters are distributed according to Gauss, initially given an upper and lower limit, and then calculated in ANSYS.
3.4.2 Analysis of PDS results
Through the calculation of PDS, the target variable values ​​corresponding to 30 sampling points are given, as shown in Fig. 5. The distribution of the target variables is unknown. The parameters are fitted again using Minitab software, and the frequency is basically distributed according to the normal distribution. This ensures the statistical theory of tolerance analysis.
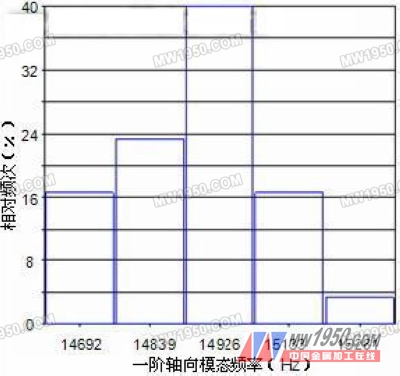
Figure 5 Monte Carlo simulation frequency distribution histogram
The PDS calculation gives a fitting formula from the design variable to the tolerance expansion of the target variable: where y is the target variable, x is the design variable, c is the correlation coefficient, and i is the variable number.

According to this, the target tolerance can be assigned to each design variable to complete the task of tolerance design.
3.5 Experimental verification
The front part is the design process of the entire welding tool. After the completion, the raw materials are purchased according to the material tolerances allowed by the design, and then delivered to the manufacturing. Frequency and modal testing are performed after manufacturing is completed, and the test method used is the simplest and most effective sniper test method. Because the most concerned index is the first-order axial modal frequency, the acceleration sensor is attached to the working surface, and the other end is struck along the axial direction, and the actual frequency of the tooling can be obtained by spectral analysis. The simulation result of the design is 14925 Hz, the test result is 14954 Hz, the frequency resolution is 16 Hz, and the maximum error is less than 1%. It can be seen that the accuracy of the finite element simulation in the modal calculation is very high.
After passing the experimental test, the tooling is put into production and assembled on the ultrasonic welding machine. The reaction condition is good. The work has been stable for more than half a year, and the welding qualification rate is high, which has exceeded the three-month service life promised by the general equipment manufacturer. This shows that the design is successful, and the manufacturing process has not been repeatedly modified and adjusted, saving time and manpower.
4 Conclusion
This paper starts with the principle of ultrasonic plastic welding, deeply grasps the technical focus of welding, and proposes the design concept of new tooling. Then use the powerful simulation function of finite element to analyze the design concretely, and introduce the 6-Sigma design idea of ​​DFSS, and control the important design parameters through ANSYS DOE experimental design and PDS tolerance analysis to achieve robust design. Finally, the tooling was successfully manufactured once, and the design was reasonable by the experimental frequency test and the actual production verification. It also proves that this set of design methods is feasible and effective.
Previous page
Led Ceiling Panel Light 120-347V
Rhein Lighting has provided a line of led ceiling panel light 120-347v. The flat panel light has No LGP, back-lit design, and the lens is made of PMMA and will not yellowing over time, which is much more bright and more durable than edge-lit light panel. Take 2x2 led light drop ceiling for example, it can replace the equivalent of 420W fluorescent tubes, saving you up to 80% in energy consumption.
The led ceiling panel light provides long-life and uniform illumination, in addition to being equipped with a 0-10V dimmable driver. These led light panels are ETL, DLC, CE, ROHS approved, and it has a 5 years limited warranty.
Rhein Lighting is a specialized in the design and manufacture of led panel downlight, led slim down light, backlit Led Panel Light, led rope light, Led Strip Light, led plant light and Led Grow Light etc.
Led Ceiling Panel Light,Artika Flat Panel Ceiling Light,Flat Led Ceiling Light,Led Lights For Drop Ceiling
Rhein Lighting Technology Co.,Ltd. , https://www.rheinlighting.com