Abstract 2 Uncertainty test 2.1 Description of uncertainty The "uncertainty" of the test machine is simply the test of the same test piece on the test machine according to the specified test method. The degree of dispersion around the ideal "true value"...
   2 uncertainty test 2.1 Description of uncertainty
The "uncertainty" of the test machine is simply to test the same test piece on the test machine according to the specified test method, and the results of the multiple test results are distributed around the ideal "true value". It is a quantitative representation of the quality of the test that is internationally recognized and is related to whether the test machine and test method standards can be recognized by the society.
"True value" is the actual size that an amount has when measured. This is an ideal concept that is not available. The arithmetic mean "A" of the measured value "xi" is usually taken n as the best estimate of the "true value".
The "dispersion" Li is the distance Li = (A - xi) from which the respective data xi deviates from the average number A.
The "standard deviation" σ is the square root after the sum of the squares of the measured deviations divided by (n-1);
σ=√(∑Li2/(n-1))
The measured Class A uncertainty is reflected by the above standard deviation σ, which means that the majority of the measurement results will likely fall within the range of ±σ. Measurement uncertainty can also be expressed in terms of the relative uncertainty of σ/A.
2.2 The method used in this test
* In order to reduce the uncertainty of the test machine uncertainty, we always use the same product of the same variety of abrasive belts when testing the uncertainty of the test machine, and try our best to maintain the uniformity of its quality.
* Uncertainty assessment should test at least 5 abrasive belts, preferably 10.
* The set values ​​of the following test conditions are consistent throughout each test:
Belt model: X871K 100#
Belt line speed: 25m/s
Test piece speed: 25r/min
Test piece: 45# steel round bar φ30mm
Belt tension: 300N
Grinding time / no feed grinding time / interval time: 20s /5s /10s
* The number of grinding tests of the belt is determined according to the actual performance of the belt. When one of the following conditions occurs in the grinding, the belt failure can be determined and the life is terminated:
A. After the grinding, the surface temperature of the test bar exceeds 250 ° C;
B. The grinding motor current exceeds the motor rating of 15A;
C. The amount of grinding removal has dropped below 1/3 of the initial value;
D. For the constant feed grinding method, the grinding pressure continues to rise and increases to 250N or more.
* In the constant pressure test mode, the amount of removal of the abrasive belt sample gradually decreases with time. This uncertainty test uses the last metal removal amount as 20 or 30% of the first removal amount to terminate the life of the belt.
*In the constant feed test mode, the amount of removal of the abrasive belt sample is constant. As the grinding time increases, the grinding pressure gradually increases until the last grinding pressure reaches and exceeds 250N. Severe burns were judged as the end of the life of the belt.
2.3 Test results
2.3.1 Test 1: 2014.03.27
Test conditions:
Constant pressure: 100N
Contact wheel: φ250×50mm Rubber layer hardness shA90° Number of teeth 31 Groove ratio 1:0.8 Spiral angle 45°
Belt specification: 50×1500mm
Test piece hardness: HRc 15.4-16.5
Working speed: 3.5mm/min
Grinding times: 40 test results: see Figure 2-1 and Table 2-1

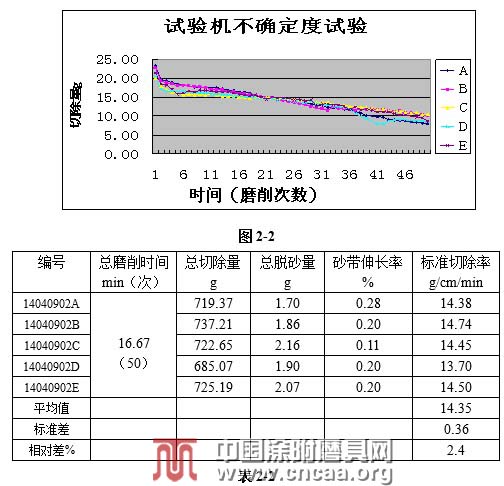
2.3.2 Test 2: 2014.04.09
Test conditions:
Constant pressure: 100N
Contact wheel: φ300×50mm Rubber layer hardness shA80° Number of teeth 33 Groove ratio 1:0.8 Spiral angle 45°
Belt specification: 50×1580mm
Test piece hardness: HRc 11.6-12.6
Working speed: 3.5mm/min
Number of grinding: 50 test results: see Figure 2-2 and Table 2-2
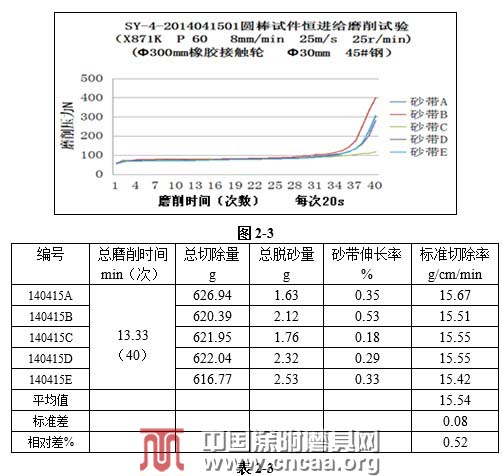
2.3.3 Test 3: 2014.04.15
Test conditions:
Constant feed rate: 8.0mm/min
Contact wheel: φ300×50mm Rubber layer hardness shA80° Number of teeth 33 Groove ratio 1:0.8 Spiral angle 45°
Belt specification: 50×1580mm
Test piece hardness: HRc 11.9-12.6
Grinding times: 40 test results: see Figure 2-3 and Table 2-3
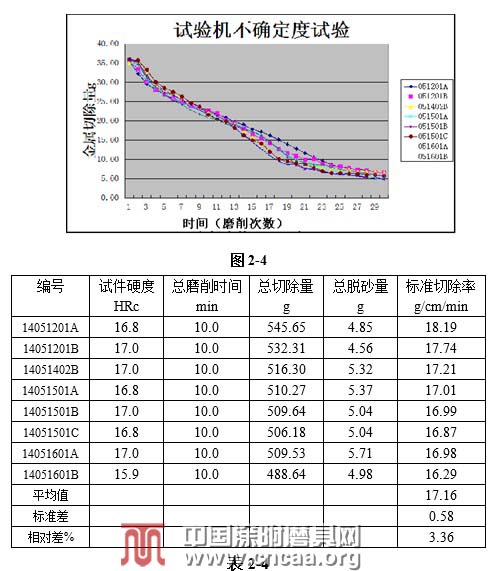
2.3.4 Test 4: 2014.5.12-16
Test conditions:
Constant pressure: 150N
Contact wheel: φ250×50mm Rubber layer hardness shA90° Number of teeth 33 Groove ratio 1:0.8 Spiral angle 45°
Belt specification: 50×1500mm
Working speed: 3.5mm/min
Test piece hardness: HRc 16-17
Number of grinding: 30 test results: see Figure 2-4 and Table 2-4
2.4 Analysis of test results
2.4.1 The three tests of tests 1#, 2# and 3# were completed in one day, and the conditions of each test were consistent. The test results of three relative uncertainties were respectively 1.1%, 2.4% and 0.5%, it can be seen that the relative uncertainty of the test machine can be controlled within the range of ≦2.5%, indicating that the test machine test results are reproducible and have sufficient credibility.
2.4.2 Test 4# A total of 8 belt tests were carried out, which were completed within four days. The relative uncertainty test result was 3.4%, which was higher than the previous test results. Further analysis suggests that although the conditions set by the testing machine within 4 days are consistent, the environmental conditions of the test, such as air humidity and temperature, are inevitable due to uncontrolled conditions in the shop.
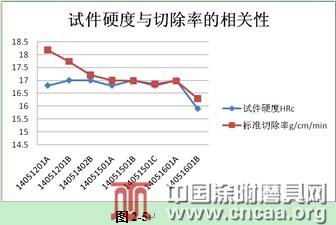
As can be seen from the curve shown in Figure 2-5, the resection rate of the first day test is higher than that of the next few days. From the curve shown in the figure, it can be seen that the resection rate on the 15th and the 16th is basically at a level. It seems that the exposure of the abrasive belt in the atmosphere is degraded by the humidity of the air. The test result with the number 01B on the 16th is lower, mainly because the hardness of the test piece used in this test is 15.9 than that of the first 7 test pieces. The average hardness was 16.9% lower than that of 16.91. The resection rate of 16.29 measured in this experiment was also 6% lower than the average of 17.28 of the first 7 resection rates; it can be seen that there is a certain correlation between the two. If the data of 01B on the 16th is excluded, the uncertainty of the first 7 trials drops to 2.85%. The test of 5.12-5.16 is also an assessment of the reproducibility of the test machine. (unfinished)
Indoor Light,Indoor Wall Lamp,Modern Style Indoor Wall Lamps,Led Down Light Indoor
Shenzhen You&My Electronic Technology Co., Ltd , https://www.youmyledlight.com